How To Start Wireframing a Data Dashboard
Overview
Teaching: 10 min
Exercises: 0 minQuestions
What are the steps to effectively create and use wireframes
Objectives
Understand the basic steps of creating wireframes
How To Start Wireframing A Data Dashboard
Four techniques to start a wireframe project from scratch and ensure that you dedicate enough time to the ideation phase, where the success of your dashboard begins.
The most common mistake people make with wireframes is rushing through them. Spending time in the ideation phase is where wireframing delivers the most ROI. It’s where user/audience/stakeholder goals and workflows are synthesized into a plan for moving from the problem space to the solution space.
An empty wireframe can be intimidating. You want the end result, a wireframe that takes the idea in your head and makes it real. And you know that at a certain point you’ll get into “the zone” where the friction disappears and designing feels almost effortless.
But now it’s still a blank page.
So, how do you go from nothing to something?
Here are a few tried-and-true methods with real examples that we use to kick start our wireframing.
Four Main Steps for starting a wireframe
- Start with words instead of pictures
- Add Elements
- Add Annotations
- Feedback/Iteration
1. Start with words instead of pictures - Brainstorming
If you’re having troubling imagining what it should look like, it probably means that you haven’t answered some important questions. Instead of diving straight into the user interface, we often start by answering some basic questions that apply to any project. This is sometimes called a Brief.
NOTE:
Leveraging existing similar data dashboard designs is also a good place to start
Questions to ask before wireframing
- Who will be using it? (i.e., the audience/users for the dashboard)
- What is their goal? What problem does this dashboard answer or ability does it enable for them?
- What are some of the data actions or operations they are likely to perform? (i.e., the workflows)
- Exactly how can the content be organized to support these goals?
- Where should your main message and logo go?
- What should the user see first when arriving at the dashboard?
- Where is the call to action?
- What will the user expect to see on certain areas of the page?
Note:
If you have a hard time answering these questions, you’re probably not ready to start wireframing. In this case, we suggest that you go back to the gathering requirements phase.
Even if you are wireframing alone, it’s useful to go through the step of explicitly writing down this information about your project. It will help you get back on track when you get stuck and will be a huge help to anyone looking at your wireframes later.
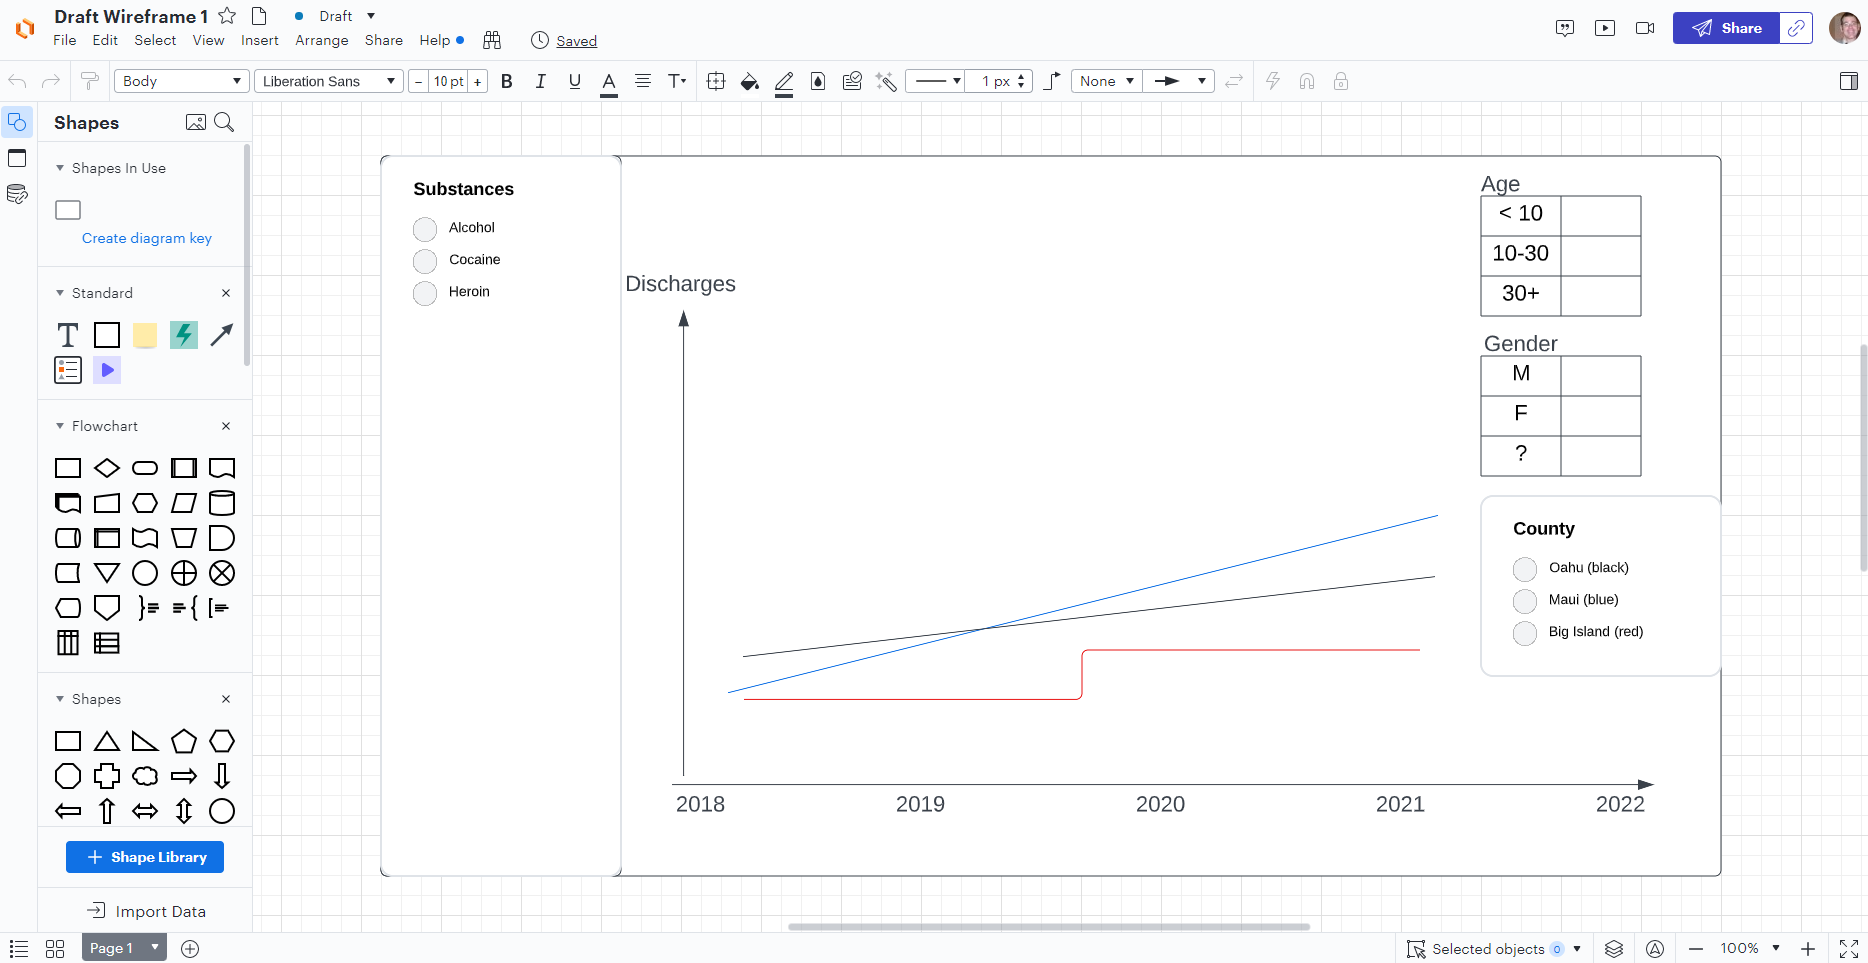
Add Elements
Start adding the elements starting with the most important visuals and move on to smaller areas such as call to actions, interactive elements, survey structures, and so on. You can also add buttons to generate reports, send notifications, do bulk actions, etc.
##NOTE
Place the most important aspect of your dashboard at the top-left corner as most users look here first
Note:
Visual language is only helpful when it is consistent, clean and simple. Use very few colors (or preferably, no colors at all except for different shades of gray) just to draw the necessary focus and contrast to the content. Use simple shapes and simplified visualization to demonstrate the relationship between elements
Add Interactions - (optional advanced wireframing)
Once you have your basic wireframe for the dashboard and related pages and screens ready, you can start adding links to interconnect various screens and page states. Once the linking has been done, you can set a transition, animation, gesture, or effect for the link. When the client clicks the component, it will jump to life, showing them how the real dashboard page will behave.
Add Annotations
The next step is to annotate or make notes in your dashboard wireframe to show the stakeholders what goes where.
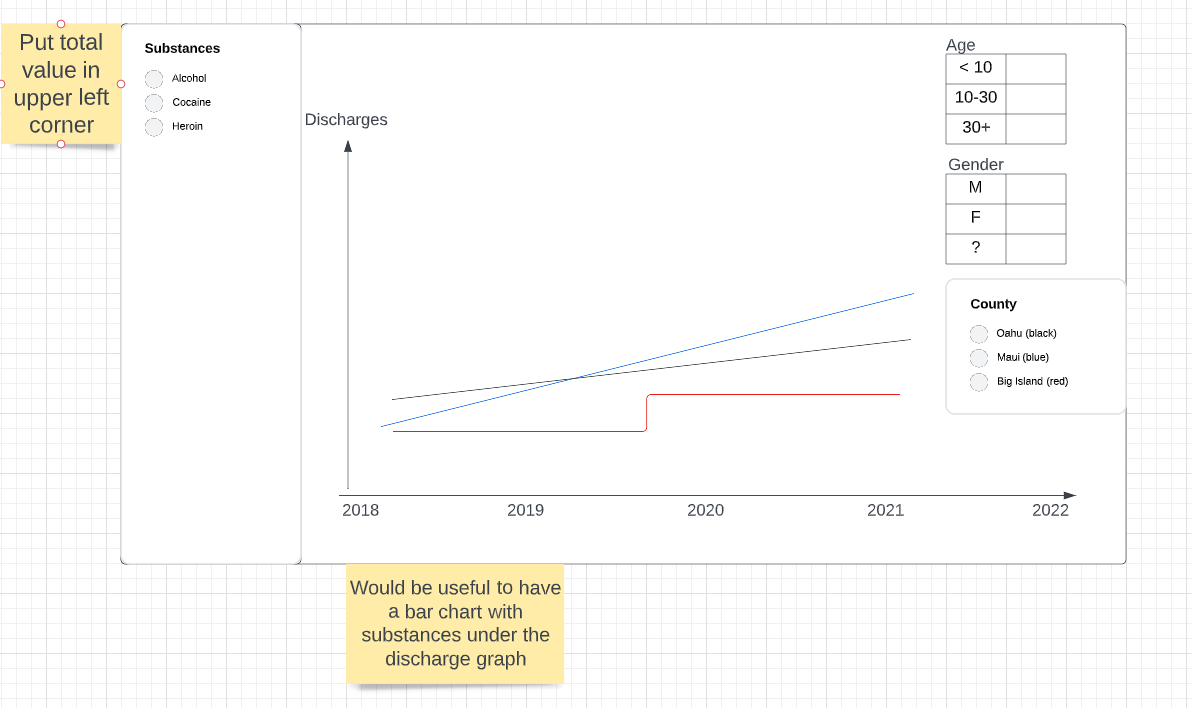
NOTE
You can use the sticky note widgets for this and add text to it to explain what a particular button does or what a particular portion of the dashboard shows.
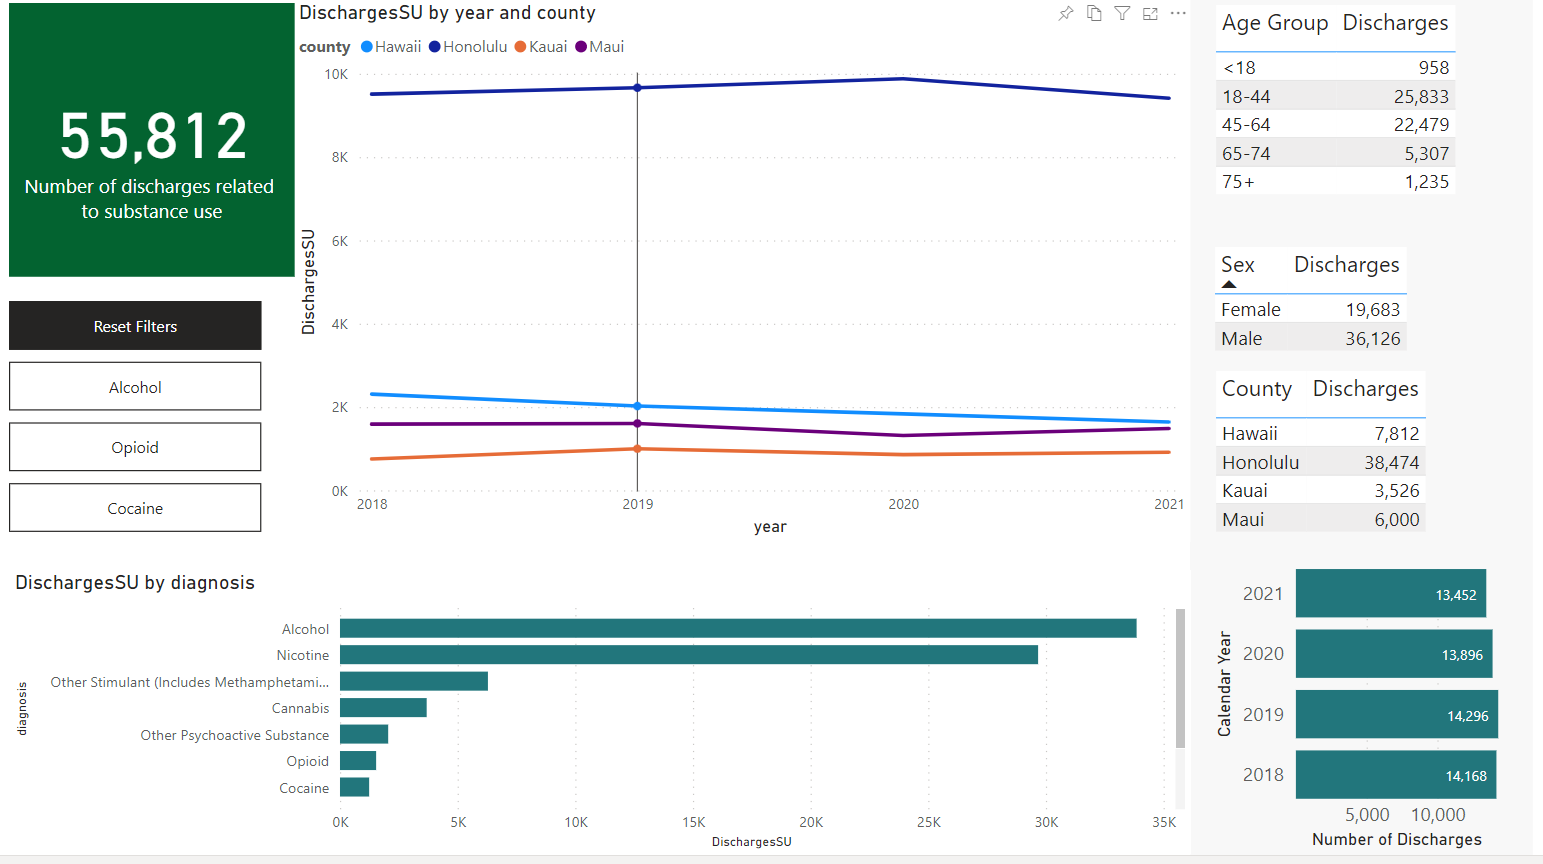
Feedback/Iteration
Your dashboard wireframe is now ready to be shared with collaborators and other stakeholders. 3
The iterative process of receiving feedback, incorporating changes, begins at this stage and continues until all parties are happy with the wireframe design. After the iterations are done, you can proceed to add design elements and other aesthetic features and finally test your prototypes with users.
Key Points
Effective wireframes rely on good requirements and asking good questions before beging any visual design
Wireframing is an iterative process, feedback is essential for wireframes to inform the end dashboard